With the growing number of users and customer base, managing datasets has become challenging and crucial at the same time. In such times, users need tools that are low-code to no-code and can help in managing data easily.
Here comes Tableau, which is currently owned by one of the top CRM companies, Salesforce.
In this blog, we discuss what is a tableau, what is tableau used for, tableau integration with different data sources, tableau vs Excel vs Power BI, and how users can leverage it for its potential.
What is Tableau?
Tableau is a data visualization and business intelligence tool that enables businesses to transform raw data into interactive, dynamic, and shareable dashboards without coding. As it has a user-friendly interface and robust capabilities, it allows users to analyze the data and present into insightful presentation without having extensive technical expertise.
This tool by Salesforce is useful for data analysts, business leaders, account managers, and those who are starting their data analysis and management journey. Moreover, it also allows for integration with different data sources.
In Tableau, users can create various charts, graphs, maps, dashboards, and stories depending on their business choices and requirements. With its unique and second-to-none features, it is considered one of the top tools for business intelligence (BI).
What is Tableau Used For?
Tableau is used for various purposes as it has vast applications in data visualization and management. Let’s look at the main applications of what is Tableau used for:
-
Business Intelligence
By using Tableau users can get actionable insights from the data and sources gathered that help in making informed business decisions. After gathering data from different sources, decision-makers get insights into trends, customer behavior, and operational performance. This helps them mitigate risks, optimize their strategy, and find loopholes.
-
Data Analysis
Another top use case of Tableau is analyzing data for in-depth analysis by applying filters, creating calculated fields, and segmenting data. By using these top features of Tableau, the decision-makers are able to save a lot of time and focus on the core aspects. For instance, if a business wants to know the current trends or wants to study customer behavior, Tableau can do it all.
-
Connecting Data Sources
As it is a data visualization tool, sources of gathered data become essential. If you are using Tableau, you can integrate data from multiple sources including spreadsheets (Excel, Google Sheets), databases (SQL, Oracle), and cloud services (AWS, Google Cloud). This allows for comprehensive data view gathered from various sources.
-
Predictive Analysis
For any business to succeed, it must be proactive rather than reactive. For this purpose, businesses need software or tools that can help them do so seamlessly and Tableau comes in handy. It integrates with R and Python for seamless and robust forecasting.
In Tableau Data Management, is considered one of the best tools for predicting forecast sales, identifying future risks, and optimizing resource allocation.
-
Real-Time Data Monitoring
Another important feature when working on data is to monitor the data in real time. This feature is important for industries like finance and retail, where immediate responses to changing metrics, such as stock prices or sales trends, are critical.
Tableau vs Excel vs Power BI
Tableau differs from Excel and Power BI in various aspects. Let’s take a look at the table below.
| Aspect | Tableau | Excel | Power BI |
|---|---|---|---|
| Purpose | Advanced data visualization and analytics. | Data organization, analysis, and basic visualizations. | Data modeling, visualization, and real-time reporting. |
| Ease of Use | User-friendly for creating advanced visualizations; requires some learning for setup. | Intuitive for basic tasks; complex for advanced analysis. | Simplifies connecting data and creating dashboards; user-friendly for beginners. |
| Data Handling | Handles large datasets effectively with excellent performance. | Limited by system resources; slower with large datasets. | Optimized for large datasets with advanced compression. |
| Visualizations | Highly customizable and interactive visualizations. | Basic charts and graphs; limited interactivity. | Strong visualizations with built-in AI-driven insights. |
| Integration | Integrates well with other analytics tools and databases. | Integrates primarily with Microsoft tools. | Seamless integration with Microsoft tools (Excel, Azure, etc.). |
| Real-Time Data | Requires third-party tools for real-time analytics. | Not designed for real-time data. | Excellent real-time analytics capabilities. |
| Deployment Options | Desktop, server, and cloud. | Desktop with limited online functionality. | Desktop, cloud, and mobile. |
Types of Visualization in Tableau
It has six main types of data visualization that users can utilize depending on their requirements. Below is a brief discussion of them.
1. Bar Chart Visualization
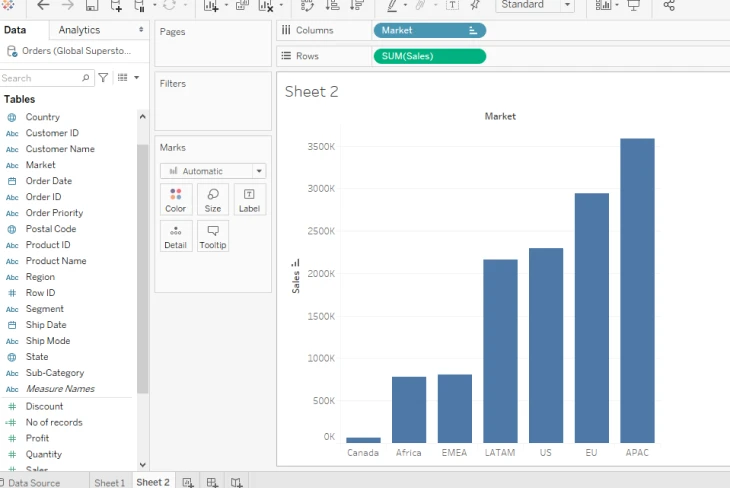
Being one of the most used visualizations in Tableau, it is perfect for comparing categorical data for which you need 0 or more dimensions and 1 or more measures.
Source: GeeksforGeeks
As the name suggests, it represents data in rectangular bards in which the length of each bar in the chart corresponds to the value it shows. If you want to show trends, comparisons, or distributions among different categories, then this chart is best as Tableau also allows you to create either horizontal or vertical bar charts, customize colors, and add labels as well.
2. Pie chart
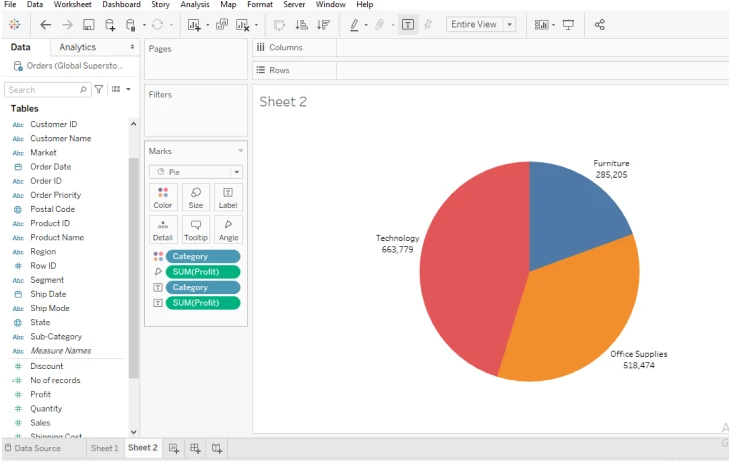
Another type of visualization in Tableau that you can use is Pie chart that is best for representing data in proportions and percentages within a dataset.
Source: GeeksforGeeks
Each slice in the pie chart is used to represent a category while the size of each slice shows the contribution to the whole.
You can use pie charts for datasets with a limited number of categories to ensure clarity. You can easily customize the colors, labels, and tooltips, making the chart more interactive and informative.
3. Stacked bar chart
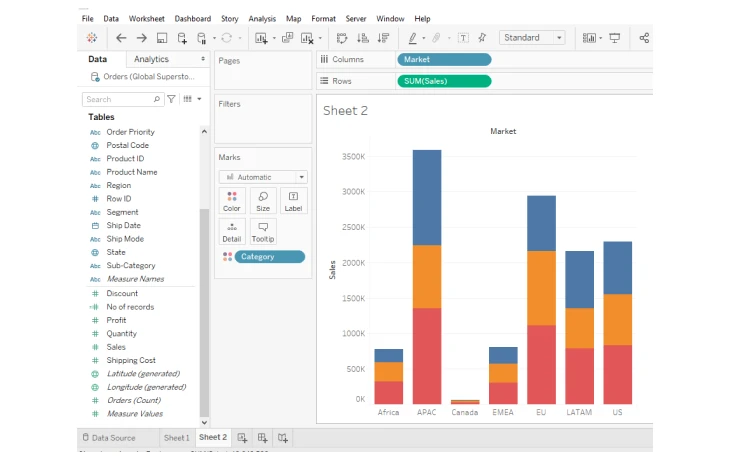
These build upon the standard bar chart by dividing each bar into segments that represent different subcategories within the data.
Source: GeeksforGeeks
This visualization is best suited for showing the composition of data across multiple categories.
For example, it can be used to display the sales of different product categories in various regions. Tableau allows users to switch between absolute and relative stacked bars, providing flexibility in data representation.
4. Side-by-side bar chart
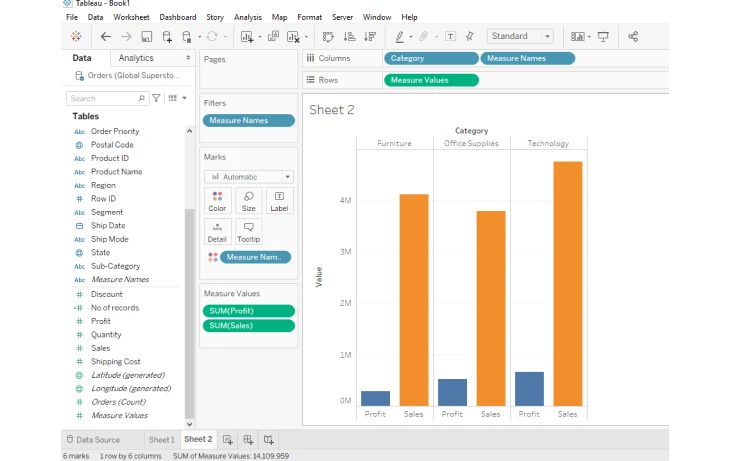
They are also called grouped bar charts. It enables users to compare the value of multiple or different categories placed next to each other’s. You can use this type of visualization for analyzing relationships between different groups, such as sales performance across various months for multiple products.
Source: GeeksforGeeks
For creating side-by-side bar chart, users must have 1 or more dimensions and 1 or more measures. You can create this chart by selecting the required dimensions and measures. Once done, click on the side-by-side bar chart on the SHOW ME section.
5. Line chart
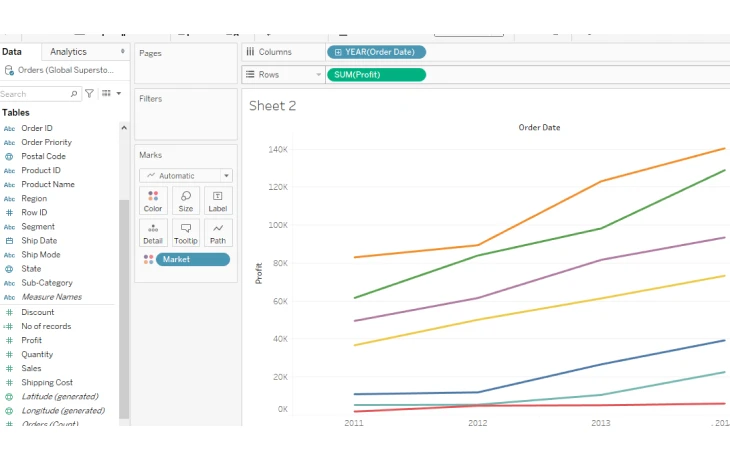
When creating line charts for data visualizations, you need an additional value. The user would need to have a date, 0 or more dimensions, and 1 or more measures. They are considered useful for creating trends or comparative analysis.
Source: GeeksforGeeks
The purpose of the line chart is to effectively communicate changes in values over a sequence, such as days, months, or years. Tableau enhances the functionality of line charts by allowing users to add multiple lines for comparative analysis, customize markers, and create dual-axis charts to compare two metrics simultaneously.
6. Packed bubbles chart
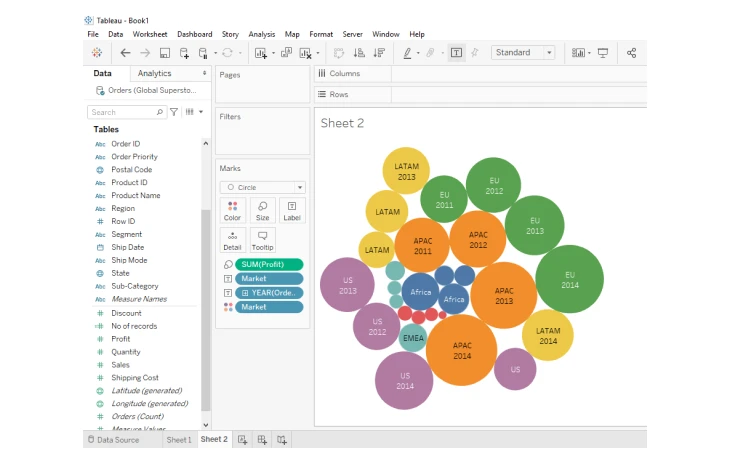
This type of visualization displays data using circles of varying sizes in which each bubble represents a category, and the size of the circle corresponds to the specific value. It is useful for showing proportions and relationships among categories in a visually engaging way.
Source: GeeksforGeeks
Tableau’s packed bubble charts allow users to add color, hover details, and grouping, making it easy to identify patterns and key contributors in the data.
How Does Tableau Work?
Being a data visualization tool, Tableau turns raw data into interactive and understandable data. It works by connecting to various data sources such as databases, cloud services, and big data platforms. Users have the option to import data in different formats. Once the data is imported from the sources, users can clean and transform the data by filtering out unnecessary information, merging datasets, or creating calculated fields to prepare the data for analysis.
Users can leverage its drag-and-drop feature to select and arrange data fields to create visualizations. Once done, the data operators start working to create dashboards and develop visualizations. The developed dashboards are then shared in the form of static files with users, where they use Tableau Reader to view these received files. In addition to that, Tableau can also publish data connected to the Tableau data engine to its server.
Is Tableau the Right Choice for Developers?
Tableau is a developer-friendly tool for various reasons such as it supports integration with popular programming languages like Python and R through its Tableau Prep and Tableau Desktop platforms. Moreover, it also offers APIs such as the Tableau JavaScript API and Tableau Extensions API for customized development. From understanding data to democratizing it, this tool is the perfect choice for developers.
Types of Tableau Products
There is a complete Tableau Products Suite that is designed for various data visualization and analysis. Below are the few top names of products:
-
Tableau Desktop
As the name suggests, it is the flagship product of the Tableau Product Suite in which the users can create interactive data reports, visualizations, and dashboards. It has a drag-and-drop interface that allows users to quickly create the chart/graph/report without having to implement the coding knowledge.
-
Tableau Server
Another product that is an on-premises solution providing a platform to organizations for hosting and managing their Tableau reporting program is the Tableau server. It provides full-fledged control over security, integration, and customization while creating reports or dashboards.
The users who leverage the Tableau server leverage a lot of flexibility along with its robust options for integrating into existing IT infrastructure.
-
Tableau Cloud
It was also known as Tableau Online previously. Tableau Cloud is a cloud-based solution that provides an online data visualization tool (which means the users do not necessarily have to have on-premises infrastructure. To say, it is a plug-and-play solution for organizations of all sizes without the added overhead of administration.
When Salesforce acquired Tableau in 2019, the users were highly encouraged to move to the Cloud as Cloud apps are also the foundation of Salesforce’s whole ecosystem.
-
Tableau Data Management
It provides the latest features such as data source cataloging, data quality checks, and automated data updates for Prep workflows. Tableau Data Management is the best option for those organizations who want to manage their content better, can schedule Prep flows to run automatically and comprehend source lineage, which is where the data is being pulled from.
-
Tableau Reader
By using Tableau Reader, the users can view charts, reports, or graphs, created by other users; at the price of the accessibility, content security, and version control that come with server and cloud installations. It is a free desktop application.
-
Tableau Pulse
Another great product in the Tableau Suite is Tableau Pulse which provides NLP and related capabilities so that users can type questions in a common language and get visualizations.
How Does Tableau Integrate with Various Data Sources?
Tableau seamlessly integrates with different sources that enable users to gather, analyze, and visualize data from diverse platforms. Businesses can unify their data for actionable insights. Below is a brief overview of the tableau integration with different data sources:
Over 70 Native Connectors
Tableau supports over 70 native connectors that make it easy to connect with different platforms and databases. It provides easy connectivity options with relational databases (MySQL, PostgreSQL, Oracle, SQL Server, etc.), cloud databases (Amazon Redshift, Google BigQuery, Snowflake, and Microsoft Azure), big data platforms (Apache Hive, Cloudera, Hadoop, and Databricks), flat files, and APIs (Excel, CSV, JSON, and XML files, as well as data streams from APIs via Tableau’s Web Data Connector).
Live Connections vs. Extracts
Tableau offers two modes for integrating data, giving users flexibility based on their requirements:
- Live Connections: Tableau establishes a direct link with the data source, reflecting real-time updates in dashboards and visualizations.
- Extract Mode: Tableau extracts a static snapshot of the data, stored locally in its efficient Hyper format, for faster analysis without constant reliance on the source.
This dual approach ensures Tableau performs well with both static and dynamic datasets.
Integration Across Cloud and On-Premises Systems
The main purpose that Tableau serves is to bridge the gap between modern cloud-based architecture and traditional on-premises systems. It supports hybrid environments, enabling businesses to leverage data stored in platforms like AWS, Salesforce, and Microsoft SQL Server seamlessly.
Data Blending and Cross-Source Joins
Tableau facilitates integration from multiple sources, even when data resides in separate systems. It offers two methods i.e., data blending and cross-source joins.
In data-blending, the datasets are combined from unrelated sources such as Google Analytics and Salesforce for unified analysis. The other above-mentioned method is cross-source joins enable the inner, outer, and left joins for data with shared fields from different systems, ensuring cohesive analysis.
APIs for Custom Integrations
Another method for integrating Tableau with other data sources is providing APIs for custom integrations. It provides APIs to extend the capabilities and functionalities. For instance, web data connector (WDC) and Tableau SDK are common names to quote. Web data connector connects to RESTful web services for fetching data from online sources whereas Tableau SDK allows developers to create custom data connectors for proprietary systems.
Conclusion
Tableau’s ability to connect to a brand range of data sources, provide data visualization, and manage complex data, makes it a preferred choice for organizations with complex data landscapes. Its integrations ensure users can effortlessly access, analyze, and visualize data to drive impactful decision-making.
Hire Tableau Developers From Devace Technologies
Hire Tableau developers to align visualizations with business objectives and translate data into actionable insights. Our developers work closely with business analysts and data scientists to create strategic insights and provide a further roadmap for decision-making. Book a meeting with us today!
Frequently Asked Questions
How does Tableau add value to your business?
Being one of the top data visualization products, it helps businesses make data-driven decisions by leveraging raw data and converting it into interactive, easy-to-understand visualizations, making trends and insights accessible to all.
Its top features like real-time analytics, forecasting, and collaboration tools, make it the best choice to provide value to your business in terms of identifying opportunities, solving problems faster, and improving operational efficiency.
Which operating systems are compatible with Tableau?
Tableau is supported on both Windows and MacOS operating systems. The desktop version runs smoothly on these platforms, while Tableau Server can be hosted on Windows or Linux environments, ensuring flexibility for different IT setups.
What types of reports can I create with Tableau?
Tableau enables users to create a wide range of reports ranging from Dashboards for real-time monitoring, Crosstab, and tabular reports, Geographic maps for spatial data, Trend analysis and forecasting visualizations to Heatmaps, scatter plots, and treemaps for advanced analytics.
You can visualize the reports and data into the above-mentioned types with its interactive database that allows developers to tailor reports according to their business requirements.
How Can I Hire Tableau Developers from Devace Technologies?
You can hire Tableau developers within 48 hours by scheduling a call with us to share your project scope and business requirements. Our team will screen the CVS to find the best candidates for your project and share them with you. You can interview the developers and finalize the one that suits your interest best.
